“The less the prudence with which others conduct their affairs, the greater the prudence with which we must conduct our own.”
– Warren Buffet
2024 started off right where 2023 ended, in the midst of a buying stampede that began in late October. Today, the S&P 500 index has been overbought for 50 consecutive days, moving it into a unique group of only 12 prior instances since 1943. The most recent occurrence was in early 2018, during a tight monetary policy environment, in which the S&P 500 plummeted nearly 20% during November and December of that year. The second most recent occurrence was in 1998, where the S&P 500 also fell over 15% from those overbought numbers in a few months. Lastly, March of 1987 saw another S&P 500 buying stampede end after 58 days of being extremely overbought. The first half of 1996 as well as 1987 were not good times to be overly bullish. As I will discuss in this Quarterly Insights, we are not overly bearish or bullish in the short term, merely cautious. We live in an environment with elevated tail risks ranging from fiscal concerns to geopolitical concerns. Please enjoy reading our latest insights.
Pros and Cons
Below are some of the items we are watching during the first quarter and into the second quarter of 2024.
Pros:
- AI and technology-led Fourth Industrial Revolution
- Low unemployment
- $6 trillion dollars on the sidelines in money markets
- Interest rates and inflation appear to have peaked
Cons:
- Oil prices up 16% with gasoline prices up 29% YTD
- Inflation is sticky, with rising energy price along with copper, lumber, and other commodities moving higher
- Valuations on equities are not inexpensive
- US Federal Government spending and Deficit are not sustainable
- Higher Treasury yields likely
- Geopolitical issues
- Investor Bullish sentiment is close to or at all-time highs
Inverted Yield Curve
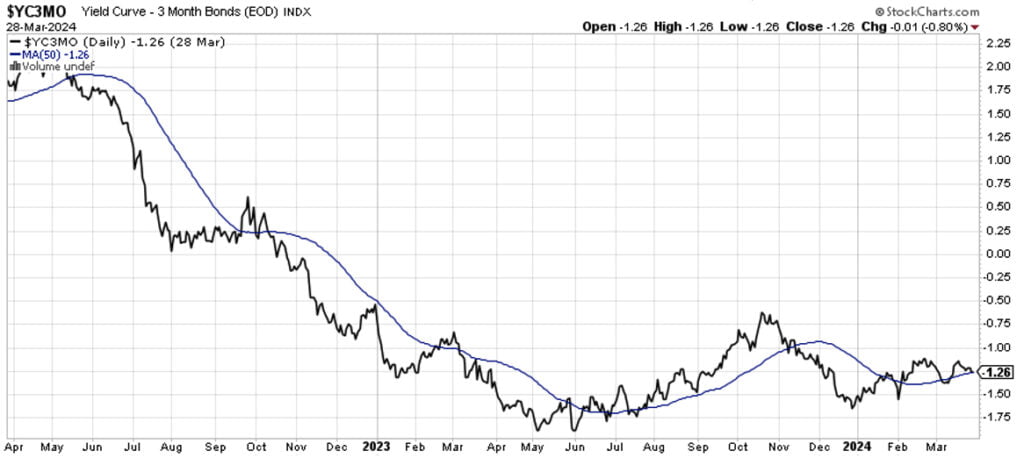
The 3 Month Treasury Yield and the 10 Year Treasury Yield curve have now been inverted for over 500 days. On average, it takes 589 days for a recession to begin. In 2007, the last time the yield curve was this inverted, the S&P 500 climbed to all-time highs through October of 2007 while the curve remained inverted until a recession appeared at day 712. The 3 Month Treasury Yield and the 10 Year Treasury Yield curve are considered one of the most reliable indicators of a recession, and investors that dismissed or did not respect it paid a hefty price in 2008 with losses on some indexes that were greater than 50%. “This time is different,” famous last words.

Source: StockCharts.com
Fear & Greed Index
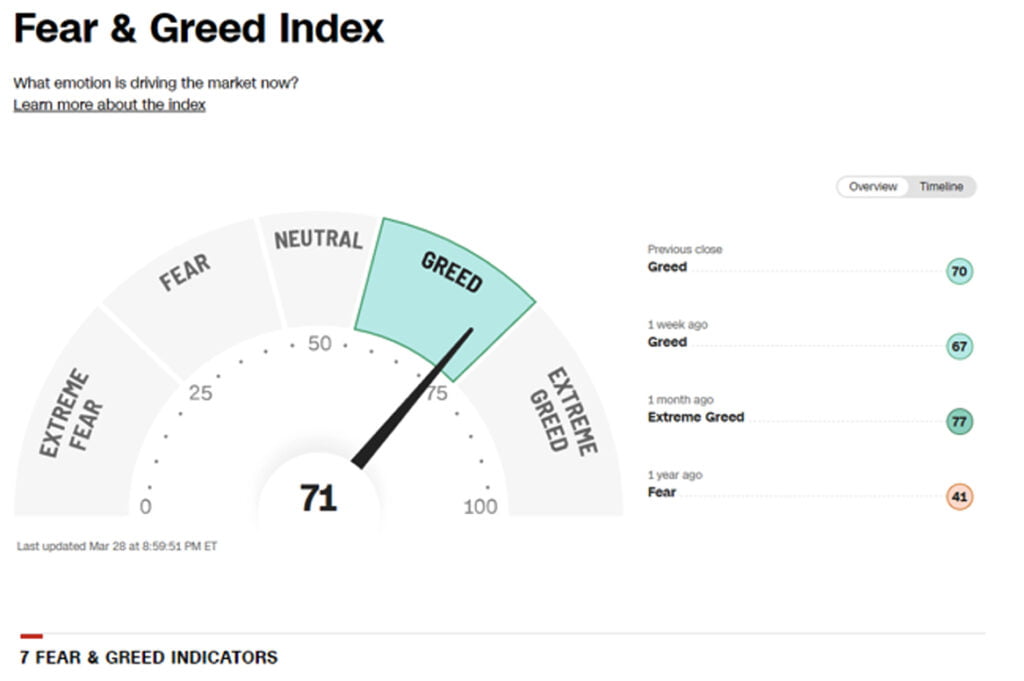
Investor sentiment is hovering around all-time highs. Most investors feel that equities and markets will never move lower. Below is a chart we use often, and it shows that investors are very optimistic on the markets. I want you to look at the 1 year ago number, it was at 41. This number is particularly important because this time last year, we had Silicon Valley Bank, Signature Bank, and First Republic Bank get shuttered by the FDIC, and the Federal Reserve launched the Bank Deposit Funding Program to prevent a systemic financial banking crisis. The S&P 500 traded as low as 3,800, investor sentiment collapsed and fear exploded higher. The average investor is often being driven by the emotions of fear and greed.
Secular Bull Market
In the short-term, we are cautious, and on intermediate to long-term, we remain bullish on the prospects of higher markets. There are a lot of uncertainties currently, and as a result of all the Covid programs and the massive infusion of liquidity into the markets, we believe investors and investments can be more susceptible to larger market moves in both directions.

