
“Chairman Powell talked quite a bit about JOLTS data – the job opening and labor turnover data. How tight it is …. Interesting thing, I look back a year ago September, it was exactly as tight as it is today. And he never said anything about inflation. What caused him to change his mind? It’s the same data.”
– Jeremy Segal, Professor of the Wharton School of the University of Pennsylvania
Thank goodness quarter three of 2022 is behind us. As we enter the fourth quarter, we reflect on a period that has seen the largest loss of investor capital ever experienced. High grade bonds lost over $3 trillion in market value and equities lost nearly $16 trillion in market value over the last nine months as Chairman Powell and the FOMC continue to raise interest rates at the fastest pace of any three-meeting span since May of 1981. This combined loss of capital has resulted in a negative 20%+ return for investor portfolios. With these declines in real wealth, it would be difficult not to slow down the US economy as Powell has stated, “We must keep it up until the job is done.” This dialogue has continued to inject fear and uncertainty into all aspects of the investment landscape while creating a very real and negative impact on business. But, we are seeing some small cracks in Chairman Powell’s resolute plan to crush inflation. On September 27th during a symposium appearance held jointly with the Monetary Authority of Singapore, Federal Reserve Bank President Mary Daly stated that she preferred to bring down inflation “as gently as possible” and further added that “price stability is fundamental, that US inflation is half due to excess demand, and about half due to constrained supply.” Federal Reserve hawks and FOMC members, Lorretta Mester and Vice Chair Lael Brainard have also recently conveyed a softer assessment on the battle against inflation.
Nike/Target and Supply Chains
As discussed in Nike’s quarterly report and earnings call, Nike noted that North American inventory grew at 65% YOY, the consumer has shifted its purchase mix and supply chains have opened up. Nike went on to say they will aggressively start liquidating inventory. Target had a similar message in their second quarter earnings call. Additionally in this quarter, we are seeing cargo ship carriers canceling sailings as Trans-Pacific shipping rates have plummeted 75% as compared to a year ago. These reports are a few examples on deflation—not inflation—and a function of the supply chains becoming more normalized and consumer demand is waning.
Mortgage Rates Reach a 15-Year High
Mortgage rates have risen from 3.01% a year ago to nearly 6.70% today, significantly raising the cost to borrowers in the housing market. A $340,000 loan on a purchase of an average home of $425,400 now costs the borrow an additional $750 per month. The monthly payment on the purchase has risen from $1,435 per month to $2,195 per month.
Pending home sales index, a leading indicator of the health of the housing market, continues to display weakness. The Pending Home Sales Index dropped by 24% as compared to August of 2021.
Lastly, mortgage refinancing has dropped to a 22-year low. The period of refinancing for home remodeling, a pool or even paying tuition for a child in college is much more expensive and it’s more likely that refinancing your home will not be a viable option.
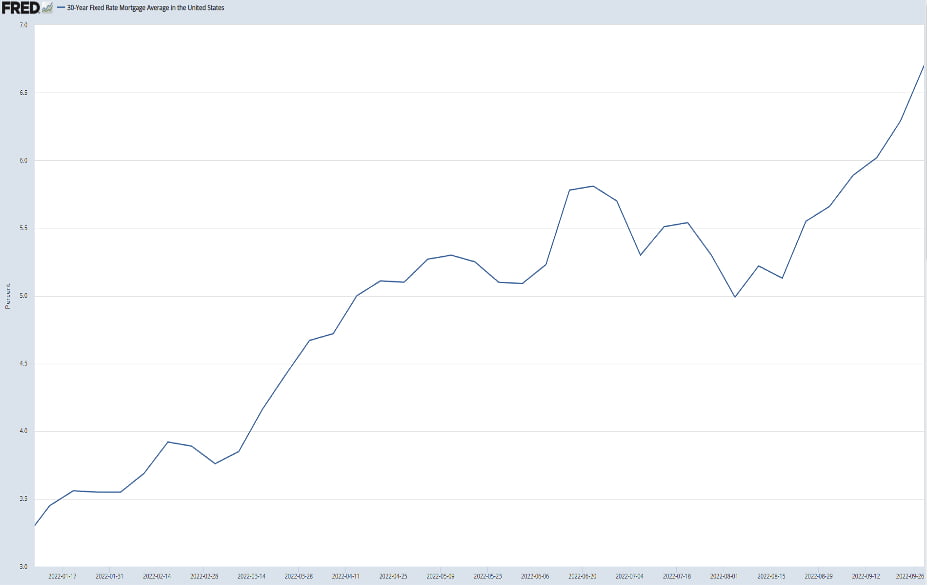
Source: The Saint Louis Fed.Org
Auto Loans
Auto loans have moved higher from 4.10% in the first quarter to nearly 5% at the end of the second quarter. There are clear signs that new car demand is softening just as supply chains are improving and inventory is set to begin rising.
The US Dollar
The US dollar continues to put pressure on equities and other risk assets as it proceeds higher, posting a nearly 15% year-to-date change. The higher dollar is a result of the aggressive interest rate policy seen this year.
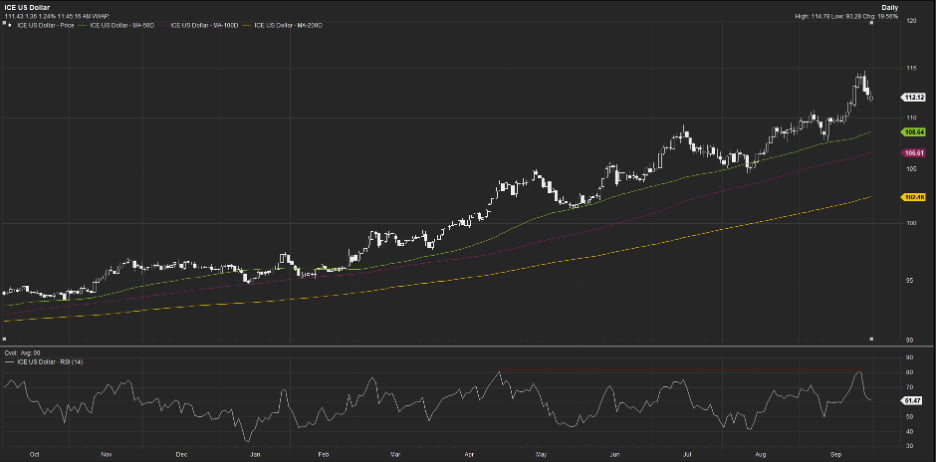
Source: The Saint Louis Fed.Org
The ICE BoA US High Yield Index Option-Adjusted Spread
This index has failed to break out to new highs during a volatile third quarter. This index, which measures risk in the junk bond market, is at elevated levels but has failed to break out to new highs in the third quarter and can be viewed to be a positive for equities.
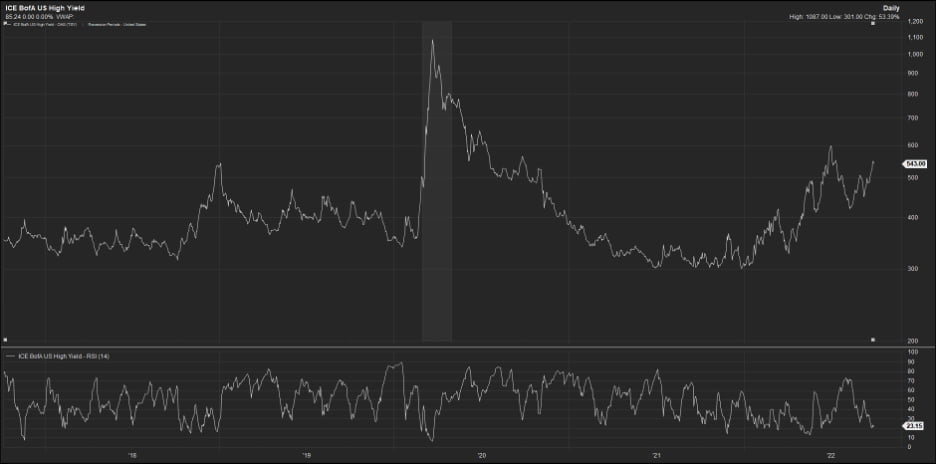
Source: FactSet
Economic Indicators
JOLTS (Job Openings and Labor Turnover Survey) is a key indicator watched by the Federal Reserve and is mentioned above in the opening quote. The August JOLTS report saw that job openings dropped sharply, falling by 1.1 million openings, representing the largest decline since the Covid-19 pandemic. To further demonstrate the weakness that the JOLTS data is showing, openings have now fallen by 15% over the previous six months. This is a good sign that the labor market is slowing down, which is a key objective for the Federal Reserve.
The September ISM Manufacturing Index decelerated in September, indicating that there is a moderation of manufacturing activity that coincides with rapidly rising interest rates. The implication is that manufacturing and growth is slowing down.
The Conference Board Leading Economic Index (LEI) and Coincident Economic Index (CEI) are both displaying that growth in the economy is slowing down. The LEI has clearly rolled over and has had six consecutive monthly declines, potentially signaling a recession brought upon by rapidly rising interest rates and a slowing US economy.

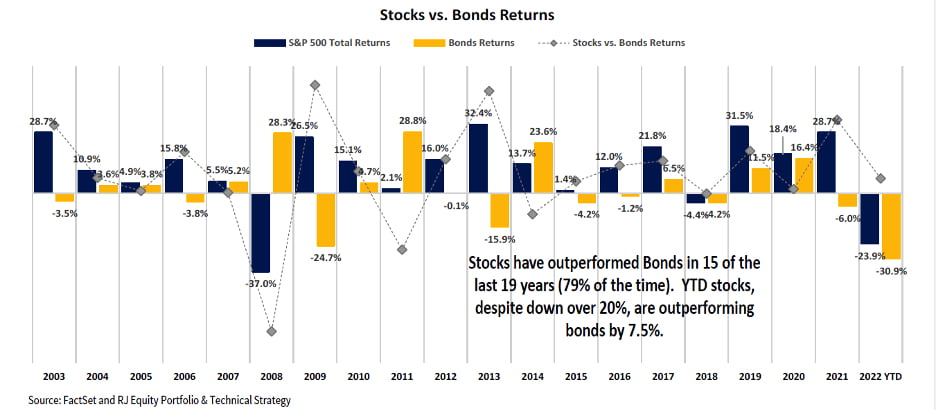
Secular Bull Market
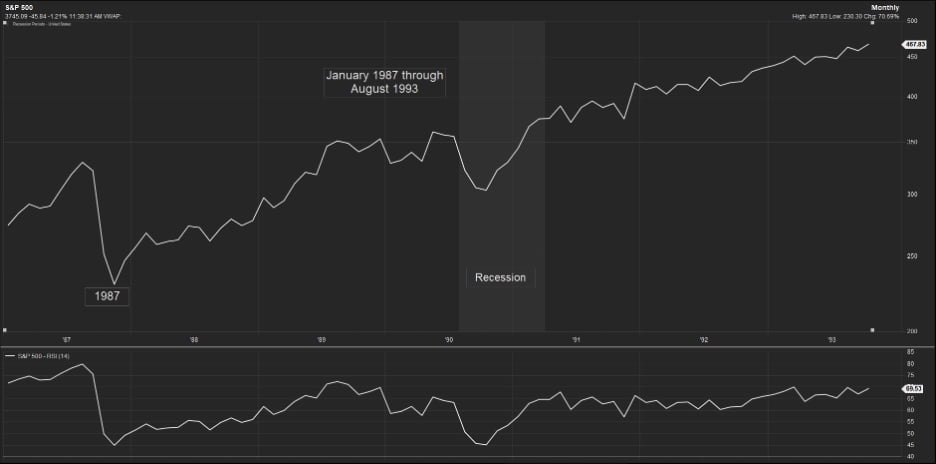
Throughout history, secular bull markets tend to last 15 to 20 years and often have contained bear markets. The secular bull market from 1982-2000 contained a 33.50% bear market in 1987, moved to new highs in 1989 and suffered a recession from August 1990 through April 1991 before regaining its upward momentum and moving to new highs in May of 1991. While corrections, crashes and recessions are painful, they are more often than not a short period in a large secular bull market’s life.
Source: FactSet