
“You can’t connect the dots looking forward; you can only connect them looking backwards. So you have to trust that the dots will somehow connect in your future.”
– Steve Jobs
S&P 500 Posts the Worst First Half of Year Since 1970 (WSJ, July 1, 2022) Well, this headline about sums it up. The second quarter of 2022 seemed as challenging as the first quarter with the first half of 2022 being the largest loss of wealth in over three decades. As shown in the below chart, from fixed income (bonds) to equities, almost every asset class was under pressure with Bitcoin (the poster child for speculation) getting absolutely smashed, down 61% through June 30th.
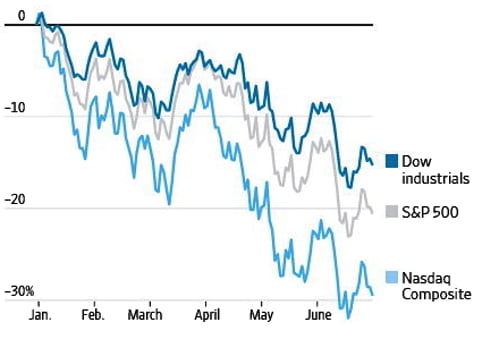
Source: Wall Street Journal
There is not much positive to say about markets in the first half of the year, but I will try to analyze our observations – which by many indications seem to point to a better second half of 2022.
Recession
The dirty “R” word. There has been lots of speculation of whether the U.S. is in or heading into a recession. To answer that question, the technical definition of a recession is two consecutive quarters of negative U.S. GDP (Gross Domestic Product) growth. The first quarter produced a negative 1.60% GDP growth and the second quarter GDP to be released on July 28th will most likely reflect negative growth as well. The positive from this is that markets are forward-looking indicators, meaning that more often than not, the markets are close to or have seen their lows once the economy is labeled to be in a recession.
Inflation and Energy
Inflation may be starting to rollover as shown in the monthly release of core Personal Consumption Expenditures (PCE). Core PCE is a measure of prices that people living in the United States, or those buying on their behalf, pay for goods and services. This closely watched indicator of the Federal Reserve continues to steadily moderate from last year. However, Core PCE excludes prices paid on food and energy. Both sectors are very important to the U.S. consumer so let’s take a look at a few commodities that drive food and energy inflation and their performance year to date.
Hard Red Wheat: The most common variant of wheat grown in the U.S. and used for breads, rolls, flours, etc., this grain is down 31% from its high.
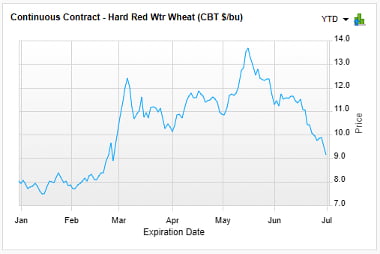
Source: FactSet
Wheat: Commonly used for breads, muffins, noodles, cakes, etc., this grain is down 35% from its high.
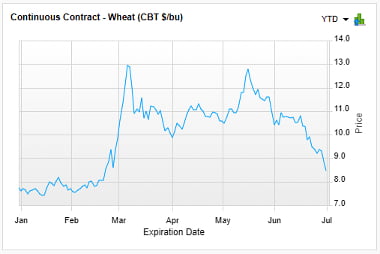
Source: FactSet
These are two widely-used grains that are significantly lower than the new highs that were set after the start of the Ukraine/Russian war. Grain market prices are higher overall as compared to the beginning of the year but the trend going forward for the consumer seems to be heading in a deflationary direction.
From the gas pump to our electricity bills, energy is a major concern for all of us. Let’s take a look at those trends as seen in the below charts.
Natural Gas: Natty gas, as known in the commodities market, is used for heating, cooling, refrigeration, cooking, ELECTRICITY, etc. It is down 32% from its high in June. Inventories of Natural Gas are heading towards normal levels in the U.S.
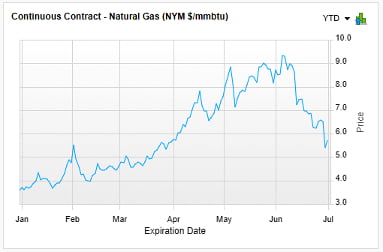
Source: FactSet
Crude Oil WTI: Drilled and produced in the United States and most commonly used for gasoline refining, it is down 14% from its high in June.
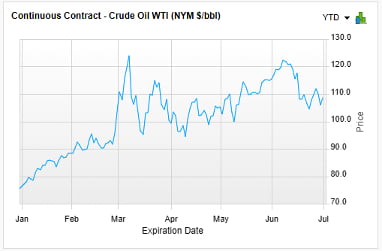
Source: FactSet
NY Harbor RBOB Gasoline: Reformulated gasoline is down 13% from its high in June.
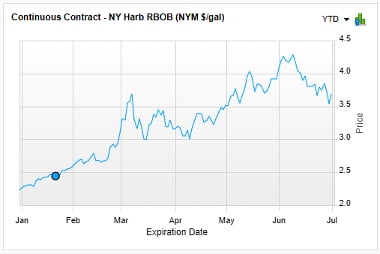
Source: FactSet
The above charts are all derived from future commodity pricing via various commodity exchanges. The key take away from the above charts is that inflation appears to be rolling over in areas of the markets that are most sensitive to the consumer. These lower prices in the commodity markets will take some time to filter into the prices paid by consumers, but they appear to be moving in the right direction of lower prices.
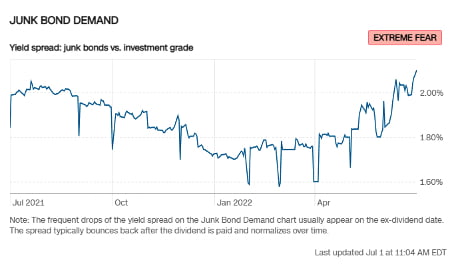
Investor Sentiment
As far as contrary indicators if you’re bullish on the markets, you do not see such extreme fear in the markets very often. These extreme indicators often coincide around markets in a bottoming process.
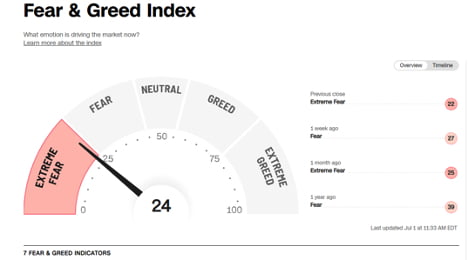
Source: CNN
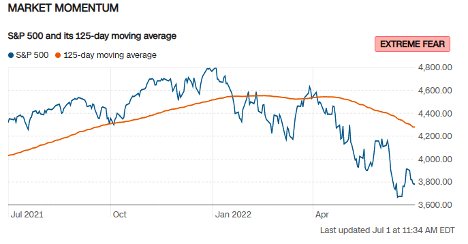
Source: CNN
Source: CNN
Federal Open Market Committee (FOMC)
The FOMC, headed by Chairman Powell, meets on July 27 and July 28 and will decide on whether to raise interest rates for the fourth time this year. It’s likely they will move on another rate increase. The real concern of the markets moving forward, particularly the equity and fixed income markets, is whether the FOMC becomes too restrictive in monetary policy and that they get behind the curve by tightening into a slowing economy as well as a potentially deflationary environment. The positive here is that the FOMC does not convene again until late September which will allow for new inflation data and the effects of rising interest rates to reflect in the updated economic data.
Summary
Inflation may have peaked, commodity prices appear to be rolling over and the stress on the U.S. consumer should start to wane. This should be a good thing for both equity and fixed income markets moving forward but it will take some time. Supply chains are getting better, COVID seems to be in the rear view mirror and the economy, while slowing, still appears to be in good shape. We still believe we are in a secular bull market that has years to go barring a major policy mistake by the FOMC or current administration and any unforeseen black swan-like events.
For additional information, I’ve shared below two insightful articles containing commentary from a pair of very successful seasoned investors, Ron Baron and Marko Kolankovic.
Ron Baron says this is a once-in-a-generation buying opportunity as stocks tumble into bear market
JPMorgan’s trading guru Kolanovic says the market will recover losses to finish year flat